.svg)
.svg)


알라미 앱을
다운받아보세요
다운받아보세요
QR코드를 촬영하시면
앱을 다운 받을 스토어로 이동합니다.
앱을 다운 받을 스토어로 이동합니다.

%201.svg)

eCPM, impressions, ad requests. Any team thinking about monetization has wrestled with these metrics in the hunt for more revenue. Everyone knows data matters, but since each mediation and network console already shows you the numbers, working directly with a data team may not even cross your mind. Yet however much data you can already see, working directly with a data team creates a different kind of synergy.
So today we're sharing how Alarmy sharpened its ad revenue by working with our data team.
Working with a data team starts with building a data environment you own. As noted above, mediation and ad network consoles each give you a dashboard to view data. But the more of those numbers there are, the more the resources spent tracking them multiply.
Analyze data across separate environments like this, and faulty analysis (and decisions made on it) become more likely. And because this is revenue, the side effect of a wrong decision lands straight on the bottom line.
As the solution, Delight Room had already built a data warehouse and runs its own data environment for the Alarmy product (see: ETL vs. ELT: which would you choose?). We brought scattered ad data into that overall warehouse design too, managed through a dedicated pipeline.
This gathered scattered ad data in one place, raised its accessibility, and gave us ownership of our ad data. Steady consistency management and flexible scalability now back our changing ad operations strategy on stable footing.
The biggest gain from a well-built data environment is efficient monitoring. As Delight Room has covered before (see: How often does Alarmy get a checkup (feat. ad metrics), How to analyze why revenue dropped), a centralized data warehouse lets us analyze ad metrics easily by any dimension we want: customer, country, ad placement. Statistical analysis of historical data also let us build a more fitting, more accurate monitoring system.
What's especially encouraging is the change that came as the warehouse ran longer. As the time we'd run the warehouse added up, we moved past simple weekly and monthly cycle analysis to read annual cycles, and our judgment of anomalies in the monitoring process grew far sharper. Building on accumulated data, we strip out daily noise and can now flag anomalies even at the granular ad unit and mediation group level. That lets us monitor with a clear line between issues that need a real response and issues that are just for reference.

Beyond analyzing ad metrics efficiently, another key gain is connecting ad data and service/product data organically. With the two areas unified in the warehouse, we moved past a simple ARPDAU metric to analyze how ads actually affect the service as a whole. This wasn't just placing two datasets side by side. It was decisive in finding the subtle balance point between ad revenue and user experience.
We can now answer deeper questions with data: "Could a newly added ad placement hurt user retention?" or "Could a user who visited a certain placement 10 times drop to 5?" Turning questions like these into metrics raised the data resolution of both ads and product together, so we can keep monitoring changes continuously.
A step further, we began logging and storing data of our own, not just user behavior logs, but data that mediation and ad networks don't provide, like latency. That latency data became central to maximizing revenue while minimizing the experience hit from ad loading. The unified warehouse built this way gives us a seamless analysis environment and enables sharper decisions.
This improved data resolution opened possibilities in our monetization strategy that hadn't existed before. The most important thing in monetization is accumulating know-how through continuous experimentation, and now, beyond raw revenue data, we can run analysis that weighs many variables together, like each placement's seasonality and DAU. That lets us judge each experiment's real effectiveness more precisely and run a monetization strategy that differs by season.
And this unified data environment naturally became the soil for surfacing new hypotheses. We look at the range of things happening in an ad placement from both the ad data and the service data, which makes deeper interpretation possible. We could break down the floor price in a waterfall setup into finer segments, analyze it, and design a variable price on that basis. Beyond the direct experiment results a mediation console shows, we can now see how a specific ad experiment affects the overall user experience and long-term revenue. The insights from this deep analysis naturally become the groundwork for the next experiment.
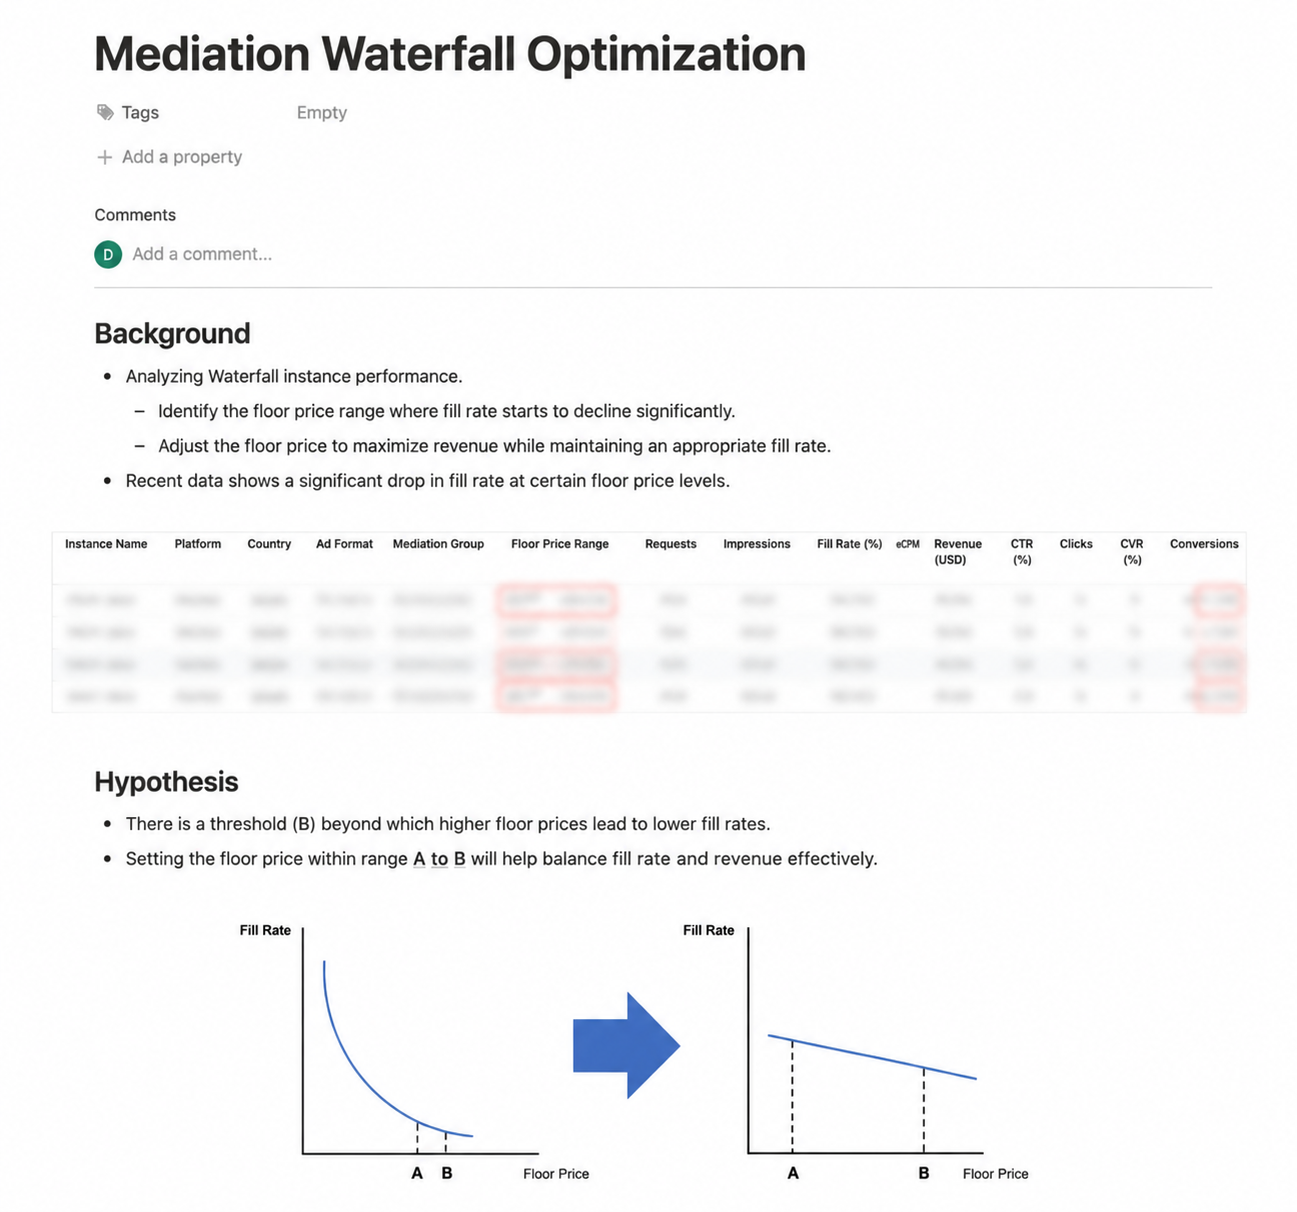
As this cycle repeats (start with analysis, form a hypothesis, run an experiment, gain a new insight), monetization know-how builds up systematically. This data-driven virtuous cycle drives not just short-term revenue gains but sustainable, stable growth.
Do you have a sense now of the synergy that working with a data team can create in the monetization domain? Everyone knows data matters, but we'd also add that to truly use data well takes a great deal of resources and hard thinking.
This is probably the point where you're curious about real examples of Alarmy's monetization. The posts that follow will get into the concrete stories.











.png)


